
A palpable feel-good factor continues to permeate the construction sector, as growth continues and a plethora of industry players report improved trading and financial results. The startling news recently was the upward revision by the Office for National Statistics (ONS) of the Q1 2014 construction output rise from the provisional figure of 0.6% to a much healthier 1.5%. This alone was sufficient to push the UK’s overall GDP growth up a notch to 0.9%.
But there was a warning from the Markit/CIPS Construction Purchasing Managers Index for May that the rate of growth had slowed for the third consecutive month.
This trend was supported by figures from the Builders’ Conference which showed that new construction contracts for May had fallen by a worrying 42%.
Markit/CIPS noted that the major cause of lower growth in May was a moderation in commercial building activity. This is a cause for concern in the context of the deteriorating financial health of the major players in this sub-sector, which we analyse in greater detail later in this report.
Some might suggest that a pause for breath might be no bad thing, given the clear signs of capacity constraints right across the industry.
Markit/CIPS reported that subcontractor availability fell in May at the sharpest pace since August 1997 and that there had been a steep increase in demand for construction materials, with input buying rising at the fastest pace for three months.
Staffing levels rose for the twelfth consecutive month, the longest sustained period of construction jobs creation since the pre-recession period from mid-2006 to early 2008. Despite these warning signs, prospects for the construction industry generally remain good, with over half the Markit/CIPS survey panel predicting a rise in business activity in the year ahead, while the London Office Crane Survey by Deloitte forecasts that office building in London will not peak until 2017.
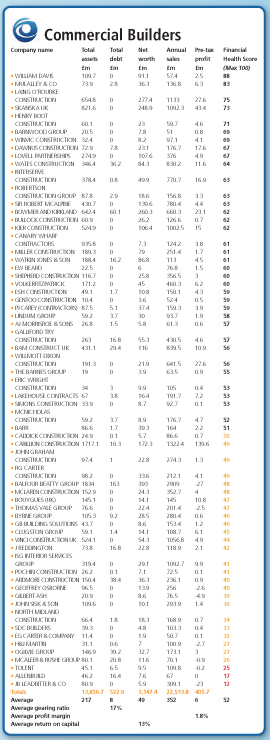
The companies we have analysed for this month’s report are commercial building contractors with turnover of at least £50m. This produced a sample of 64 companies. A year ago, our sample using the same financial criteria amounted to 74 companies. The missing ten contractors have dropped out because their annual sales have dropped below our de minimis limit; in some cases the fall in turnover has been substantial.
This single statistic illustrates the commercial problems faced by major commercial building contractors whose business profiles may be dominated a small number of large contracts. Several companies have struggled to maintain workloads as these projects near completion.
This effect may be temporary as the initial recovery becomes fully established. It must be remembered that our analysis is based on the latest accounts filed at Companies House, mainly for periods ending in 2013, or even as far back as late 2012. This inevitably means that the figures available to us at this time do not yet reflect the financial fruits of the surge in construction activity over the past few months.
Nevertheless, the toll taken by the later stages of the recession shows through starkly in the finances of our sample of 64 companies. Unlike last month’s analysis of road builders, who had prospered in the previous year, their commercial building compatriots have seen every aspect of their financial profiles worsen.
Debt levels have risen, with the average gearing ratio now at 17% compared to 13% a year ago. These are modest borrowing levels, but the trend is undesirable. Much more worryingly, their already slim profit margins have fallen heavily by over a third from a marginal 2.8% to a worrying 1.8%. Average return on capital is also sharply lower, down from 21% this time last year to only 13% now.
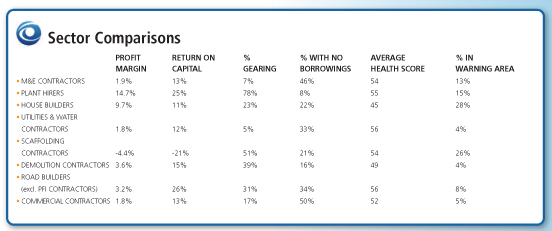
Comparing these financial characteristics with other construction sectors, commercial building contractors are operating with margins equalled in marginality only by utility & water contractors and worse than every other sector we have reviewed in the past year, apart from scaffolders where one rogue loss-maker dragged the whole sub-sector into negative territory. Plant hirers earn 14.7%, house builders 9.7%, demolition contractors 3.6%, road builders 3.2% and M&E contractors 1.86%.

The picture in terms of return on capital employed is slightly better. The figure of 13% for commercial building contractors beats the negative scaffolders, as well as house builders (11%) and utility & water contractors (12%). It equals M&E contractors, but lags behind road builders, who top the league with 26%, beating plant hirers (25%) into second place by a whisker and pushing demolition contractors into third at 15%.
As noted, gearing levels have risen for commercial building contractors but remain modest at 17% compared to others such as scaffolders at 51%, demolition contractors (39%), road builders (31%) and house builders (23%). Half of the companies have no external borrowings, the best outcome for all of the sub sectors. The full details of these various financial comparisons are set out in our sector table (above).
Looking next at the overall financial health of the sample, the Company Watch H-Score averages 52 in this sector – very significantly above the norm of 45 for all UK companies of similar size.
Company Watch produces an H-Score – a financial health-rating - for every UK company based on the interaction between seven key financial ratios involving profitability, funding and asset management. All the data used is extracted from published financial information. The H-Score is a number between 0 and 100, with those between 76 and 100 indicating companies in excellent financial health. Companies scoring between 51 and 75 are performing adequately while a score between 26 and 50 indicates a company that is financially below par.
Those that cause concern have scores of 25 or below. This is the Company Watch “warning area” indicating abnormal financial vulnerability. Over the past 15 years, a very high percentage of UK companies that filed for insolvency or underwent a financial restructuring were in this warning area at the time. Of course, not every company in this warning area fails, but it is a clear indication of heightened financial risk for clients, suppliers and service providers alike. At 52, the average H-Score for the 64 companies in this sample hasn’t shifted far from last year’s, at 53. Conservative debt levels play a major part in this outcome, as does the fact that there are no companies with negative net worth (liabilities greater than assets). Equally, only eight (13%) companies are loss making and in all but two cases the losses are minor. However, last year only five companies were in the red.
Three out of the sample (5%) are in the Company Watch warning area, the same outcome as last year. It ranks the commercial building sector as the third best on this test. Across the economy as a whole, the expectation would be that around 25% of any sample would be in this financial twilight zone. Looking at the better performers, 56% of the sample have H-Scores of 51 and above, as compared to around 50% for all UK companies.
The results of our research are worrying, with a marked deterioration over the past twelve months on every single significant measure. It is just as well that the debt levels are conservative. But it is worth repeating once more the comments from our previous reports that our analysis covers only a small number of major players out of a market that also features thousands of smaller, generally undercapitalised and usually family-owned SMEs, many operating as subcontractors. Even more caution is needed about their finances.
As I have said before, a consistent characteristic of the growth phase following every recession for the past 40 years is that insolvencies have tended to peak somewhere between 15 and 18 months after sustained recovery takes hold. Survivor companies, having burnt through their reserves during the downturn, often struggle to raise the extra working capital they need to fund increased sales and investment as things pick up.
This effect is likely to be particularly marked as we move further into the second half of 2014 with the banks, which took such a battering during the recession, still busy repairing their own balance sheets. They have less money to lend and are much choosier about which contractors they will support. It should be noted that corporate insolvencies rose in the first quarter of this year after several years of decline. We will soon know if this is just a straw in the wind or a genuine trend.
So what lies ahead for the commercial building contractors? Are these results just the last gasp of negative recessionary influences, soon to be replaced by healthier returns as the current growth spurt feeds through into improved profitability? Or will rising input costs and downward pricing pressures in a savagely competitive market turn them into busy business fools? The jury will be out until this time next year.
This article first appeared in the July 2014 issue of The Construction Index magazine, which can be viewed in full at: http://epublishing.theconstructionindex.co.uk/magazine/july2014/
While the magazine is free to view online, a subscription is required to receive you own hard copy every month. This can be purchased for just £35 a year at http://www.theconstructionindex.co.uk/magazine
Got a story? Email news@theconstructionindex.co.uk