.png)
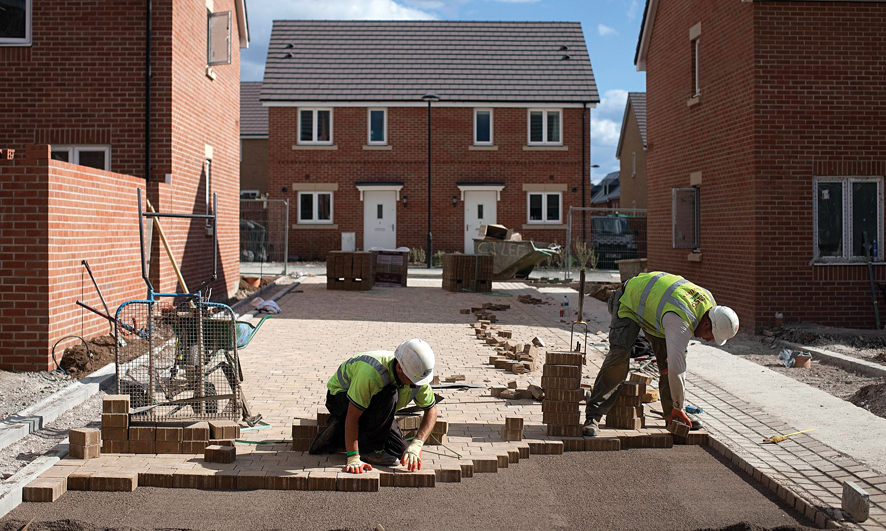
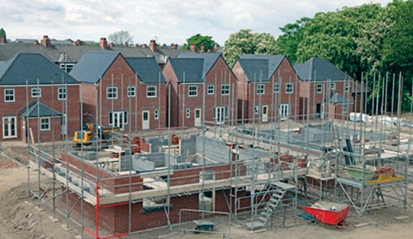
For more than year now, news from the construction industry has been dominated by the astonishing transformation of the house-building sector, given new life, post-recession, by the government’s Help to Buy scheme and now being carried along on a wave of rampant house-price inflation.
Every announcement of financial results by a listed house builder is sprinkled liberally with startling statistics: heady increases in average selling prices; completion volumes; forward sales; margins and not least of course, profits.
By way of example, one very recent trading update spoke of revenues increasing by 30%, unit sales by 23% and operating margins by 17% after 43 weeks of the company’s current financial year. The Office for National Statistics (ONS) output figures for September are a perfect illustration of how this sector stands out. Overall construction output for the month rose 1.8% against August 2014 and 3.5% on September 2013. For Q3 2014, it was 0.8% higher compared to Q2 2014 and 2.9% compared to Q3 2013. But within this, housing activity has soared by 22.3% in the past year, a truly astonishing achievement.
New home registration numbers reported by the NHBC were up 8% nationally in Q3 2014 year-on-year and are now at their highest levels since 2007, although few would have predicted that the largest rise would be in the West Midlands (51%).
The prospects are that strong growth will continue, with the Construction Products Association expecting housing starts to grow by another 10% in 2015 and by a further 16% by the end of 2018. It’s no wonder the London Chamber of Commerce predicted that the construction sector’s workforce will need to grow by 20% over the next three years. The companies we analysed for this month’s report are those with annual turnover of £50m or more in their latest published accounts. The sample is made up of 35 UK-based companies and wherever possible we have taken our data from a specific independent or group company engaged solely in house building, although in two instances (Galliford Try and Kier Group) we were obliged to extract the requisite information from the sectoral analysis in their consolidated group accounts.
The Company Watch data on the financial status of our leading UK house builders shows a comfortable level of profitability, well above the other sub-sectors featured in our previous reports (with the sole exception of plant hirers who earn 15%).
Overall, house builders’ margins were nearly 13% on reported turnover up from 10% a year ago - riches indeed compared to less than 2% for utility and water contractors, commercial builders and M&E contractors and less than 4% for demolition companies and road builders.
The trade-off between risk and reward varies across the construction industry, particularly when profits and borrowing levels are compared. Plant hire companies have to earn higher profits to compensate for a heady 79% average gearing. By contrast, M&E contractors may make just 1% profit, but their gearing is only 7%. House builders sit nearer the middle of the spectrum; they earn 13% but they only borrow 14% of their net worth. Their gearing has fallen considerably in the past twelve months, down from 23% back then.
House Builders
| Company name | Total assets £m | Total Debt £m | Net worth £m | Annual sales £m | Pre-tax profit £m | Financial Health Score (Max 100) |
| MJ Gleeson | 152.6 | 2 | 128.1 | 81.4 | 121.6 | 99 |
| Persimmon | 2,999.4 | 0 | 2,045.5 | 2,085.9 | 337.1 | 89 |
| Wain Group | 127.3 | 12 | 59.8 | 120.3 | 22 | 82 |
| Mactaggart & Mickel Homes | 175 | 12 | 59.8 | 120.3 | 22 | 82 |
| Bovis Homes | 1,093 | 29.9 | 810.3 | 556 | 78.8 | 81 |
| Strata Homes | 71.9 | 16 | 39.3 | 80.4 | 8.8 | 80 |
| Taylor Wimpey | 3,565.1 | 100 | 2,251.8 | 2,295.5 | 306.2 | 79 |
| Hopkins Homes | 87.9 | 23.6 | 47.4 | 70.7 | 10.2 | 79 |
| Abbey Developments | 79.2 | 0 | 45.2 | 62.4 | 9.9 | 78 |
| Crest Nicholson | 873.2 | 82 | 470.3 | 525.7 | 80.9 | 76 |
| Barratt Develoments | 5,141.2 | 200 | 3,354 | 3,157 | 390.6 | 75 |
| Weston Group | 111.1 | 74.5 | 23.9 | 115.3 | 7.2 | 75 |
| Croudace Homes | 154.4 | 20.2 | 97.4 | 139.7 | 12.9 | 72 |
| Lovell Partnerships | 274.9 | 0 | 107.6 | 376 | 4.9 | 67 |
| Redrow | 1,302.1 | 227.4 | 695.7 | 864.5 | 132.6 | 57 |
| Cala | 318.8 | 64.9 | 93.3 | 230.6 | 11.1 | 56 |
| Bellway Homes | 1,609.8 | 53.6 | 558.3 | 1,107.4 | 142.8 | 52 |
| Keepmoat Homes | 152.9 | 0 | 26.5 | 157.3 | 15 | 51 |
| Countryside | 755.4 | 0 | 285.8 | 277 | 5.6 | 49 |
| Hill Partnerships | 114.1 | 1 | 22.2 | 159.7 | 2 | 49 |
| Willmott dixon | 67.6 | 0 | 8.4 | 197.4 | 3.3 | 45 |
| Cruden | 47.9 | 5.3 | 11.7 | 57.2 | 2.8 | 44 |
| Millgate | 64.1 | 24.9 | 29.1 | 51.3 | 8 | 32 |
| Berkeley Group | 2,950.3 | 1 | 1,441.3 | 1,620.6 | 380 | 29 |
| Mccarthy & Stone | 795.3 | 158.5 | 431.4 | 310.8 | -11.8 | 28 |
| Bloor homes | 507.1 | 8.2 | 58 | 378.4 | 29.5 | 26 |
| Mount Anvil | 76.2 | 0 | 1.4 | 88.7 | 0.2 | 21 |
| Miller Homes | 518.8 | 31.9 | 94.7 | 326.3 | 6.9 | 19 |
| Fairview | 178.2 | 5 | 129.6 | 141.5 | -29.5 | 18 |
| Kier Group | N/a | N/a | N/a | 284 | 18.5 | 16 |
| Galliford Try | N/a | N/a | N/a | 760 | 115 | 15 |
| Banner Homes | 176.5 | 87.5 | 37.8 | 111.1 | 8.5 | 13 |
| Morris Group | 292.8 | 186.1 | 61.8 | 131.3 | 7.1 | 7 |
| Stewart Milne | 398.7 | 206 | 102.1 | 211.1 | -5.7 | 7 |
| Avant Homes | 348.9 | 325.2 | -43 | 245 | -14.5 | 1 |
| Totals | 25581.7 | 1974.1 | 13657.9 | 17429.9 | 2226.4 | |
| Averages | 775.2 | 59.8 | 413.9 | 498 | 63.6 | 50 |
| Average gearing ratio | 14% | |||||
| Average profit margin | 13% | |||||
| Return on capital | 16% |
Sector Comparisons
| Profit margin | Return on capital | % gearing | % with no borrowings | Average health score | % in warning area | |
| Utilities & water contractors | 1.8% | 12% | 5% | 33% | 56 | 4% |
| Scaffolding contractors | -4.4% | -21% | 51% | 21% | 54 | 26% |
| Demolition contractors | 3.6% | 15% | 39% | 16% | 49 | 4% |
| Road builders | 3.2% | 26% | 31% | 34% | 56 | 8% |
| Commercial contractors |
1.8% |
13% | 17% | 50% | 52 | 5% |
| M&E contractors | 1% | 7% | 7% | 60% | 52 | 9% |
| Plant hirers | 14.9% | 26% | 79% | 4% | 59 | 8% |
| House builders | 12.8% | 16% | 14% | 20% | 50 | 26% |
Seven companies (20% of our sample) have no external borrowings at all. The average return on capital for our house builders is a respectable 16%, a huge improvement on last year’s 11%. Looking next at the overall financial health of our sample, the average Company Watch H-Score is 50, which is just above the norm of 49 for all UK companies of similar size.
The principal reason for this is not necessarily just an average level of financial health; instead it reflects the degree to which the high value of their land banks distorts the structure of their balance sheets and varies from accepted financial norms. It should be noted that this average has climbed from 45 a year ago, a significant improvement in such a short period. Nevertheless, this is the second-lowest reading of the eight sectors we have analysed previously. The best average rating has been for plant hirers, which scored 59. Full details of how the other sectors fare on this measure and other key financial health indicators is set out in the sector comparisons table elsewhere in this report. Nine of the house builders (26%) are in the Company Watch warning area. This is also broadly in line with the economy as a whole, where the expectation would be that around 25% of any sample would be in this financial twilight zone.
Looking at the better performers, 52% of the sample have H-Scores of 51 and above, as compared to 50% for all UK companies. Most of our sample have avoided two of the major potentially adverse factors we track: only one has negative net worth, while it and three others are loss-making.
The results of our research are certainly encouraging, especially the improvement in all key measures since this time last year; but it is worth repeating from our previous reports the warning that our figures cover only the major players out of a market also populated by many smaller, generally undercapitalised and almost exclusively family-owned and managed SMEs building out single units or small sites.
The prospects for these companies are distinctly less rosy, not least because they operate so much on a hand-to-mouth basis, especially with regard to obtaining sites. They lack buying power and the cushion of the land banks held by their larger brethren. In addition, the sector is highly dependent on its legion of specialist subcontractors and their tenuous funding arrangements. One of the more remarkable features of this recession has been the inexorable fall in business failures, which continues even now well into the recovery phase when traditionally problems would be expected to increase due to pressure on working capital caused by unfunded growth.
Construction has always seen the highest numbers of insolvencies of any sector in the economy, often 20% or more of all such commercial tragedies. This percentage is now down to 16%. Insolvencies have dropped 41% from a total of 7,122 in 2009 to only 4,219 in 2013. They have continued to subside this year, down another 18% to the end of June compared to 2013. For most of the major house builders covered by our research, future prospects look excellent, both in the short and medium term. Nevertheless, there are challenges ahead for them. Eventually interest rates will rise, creating uncertainty about affordability for house buyers and adding extra debt servicing costs for house builders.
Solving skills shortages will inevitably be problematical and there are persistent upward input cost pressures, which will pare back their burgeoning margins. The good times may still be rolling for them, but one day they may find the financial road bumpier than the current smooth ride
Got a story? Email news@theconstructionindex.co.uk