

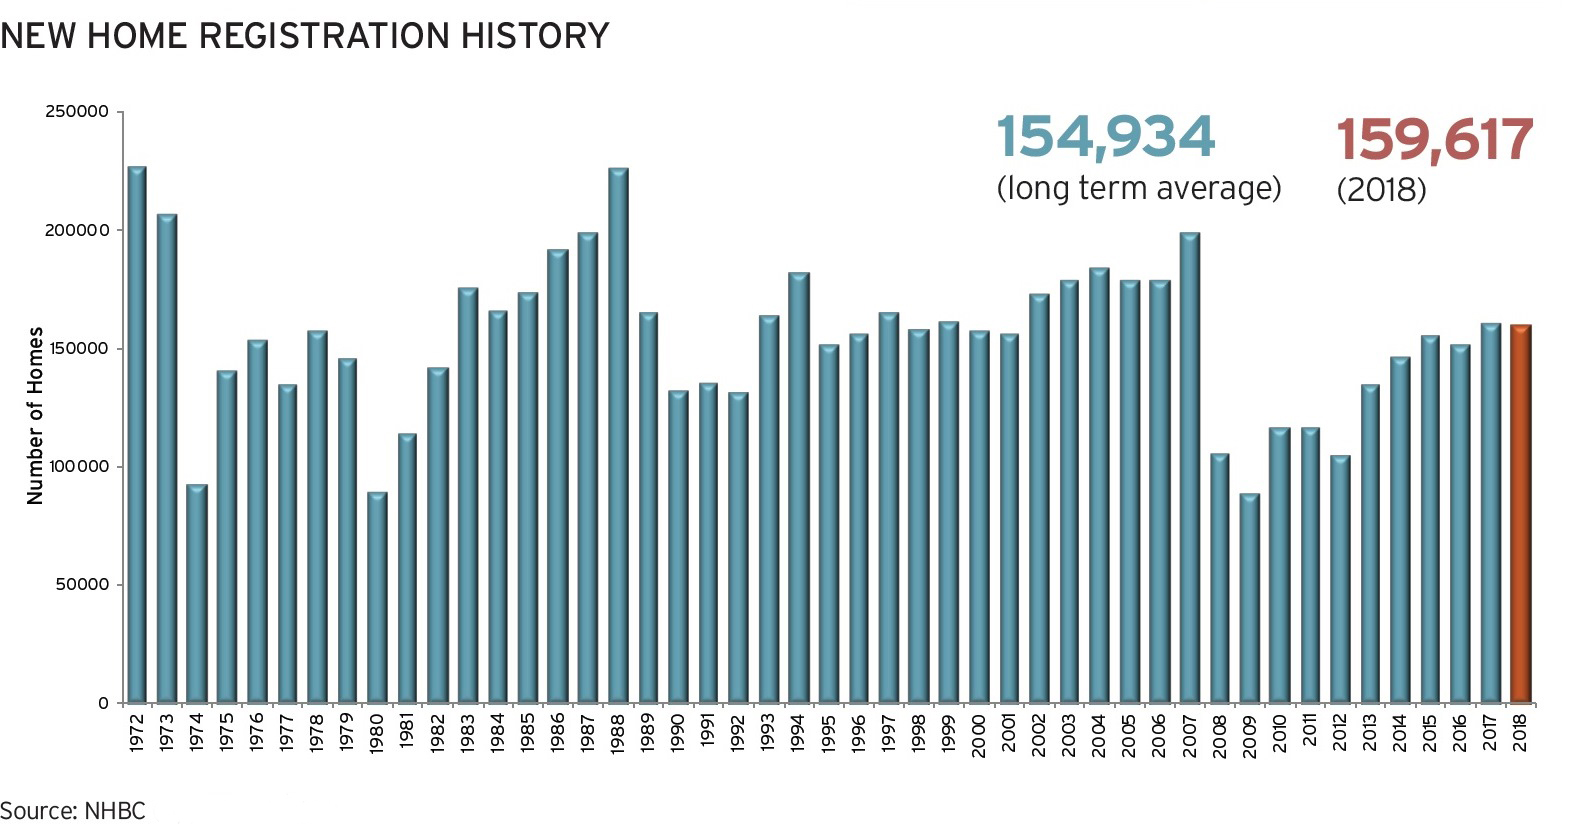
Overall, housing developers registered 159,617 new homes with the industry’s dominant warranty provider, which was a 0.5% decrease on the 160,396 in 2017.
The private sector was down 1% at 117,497 in 2018 (118,372 in 2017) while the affordable sector was practically unchanged at 42,120 (42,024 in 2017).
New home completions for the year were up 1% on 2017 to 149,480 in 2018 (147,552 in 2017).
NHBC reckons to have 80% of the UK warranty market for new build homes, so its numbers are a strong indication that house-building growth has stalled, although this could be down to the hard winter at the start of the year. After the frost thawed and the snows melted, there were seven consecutive months of year-on-year growth in NHBC registrations.
As the year drew to a close, the final quarter (October to December 2018) showed a 2% increase in the UK’s new home registrations to 40,513 (2017 Q4: 39,736).
Overall, there was growth in six out of the 12 UK regions in 2018 when compared to 2017, including Yorkshire & Humberside (+20%) and the Northwest (+7%). The biggest leap, however, was seen in Northern Ireland, where new home registrations grew by 39% over 2017 to more than 4,900.
In London, by contrast, new home registrations were down 10% in 2018 at 16,069 (17,932 in 2017).
NHBC chief executive Steve Wood said: “The full-year figures of nearly 160,000 new home registrations demonstrate the resilience of the UK house-building industry. 2018 has been a demanding year, with the extreme weather conditions in the early part and the continuing political and economic uncertainties, which are extending into 2019. Whatever the environment, NHBC will continue to support housebuilders to deliver the high-quality, new homes that the country needs.”
|
NHBC - UK Registrations by Region |
||
|
England - Regions |
2018 |
2017 |
|
NORTH EAST |
6,379 |
6,600 |
|
NORTH WEST & MERSEYSIDE |
18,079 |
16,916 |
|
YORKSHIRE & HUMBERSIDE |
11,196 |
9,363 |
|
WEST MIDLANDS |
13,447 |
14,980 |
|
EAST MIDLANDS |
13,087 |
14,503 |
|
EASTERN |
17,707 |
17,316 |
|
SOUTH WEST |
14,315 |
15,107 |
|
LONDON |
16,069 |
17,932 |
|
SOUTH EAST |
26,871 |
26,026 |
|
TOTAL ENGLAND |
137,150 |
138,743 |
|
SCOTLAND |
12,096 |
12,689 |
|
WALES |
5,463 |
5,443 |
|
NORTHERN IRELAND & ISLE OF MAN |
4,908 |
3,521 |
|
TOTAL UK |
159,617 |
160,396 |
Got a story? Email news@theconstructionindex.co.uk