

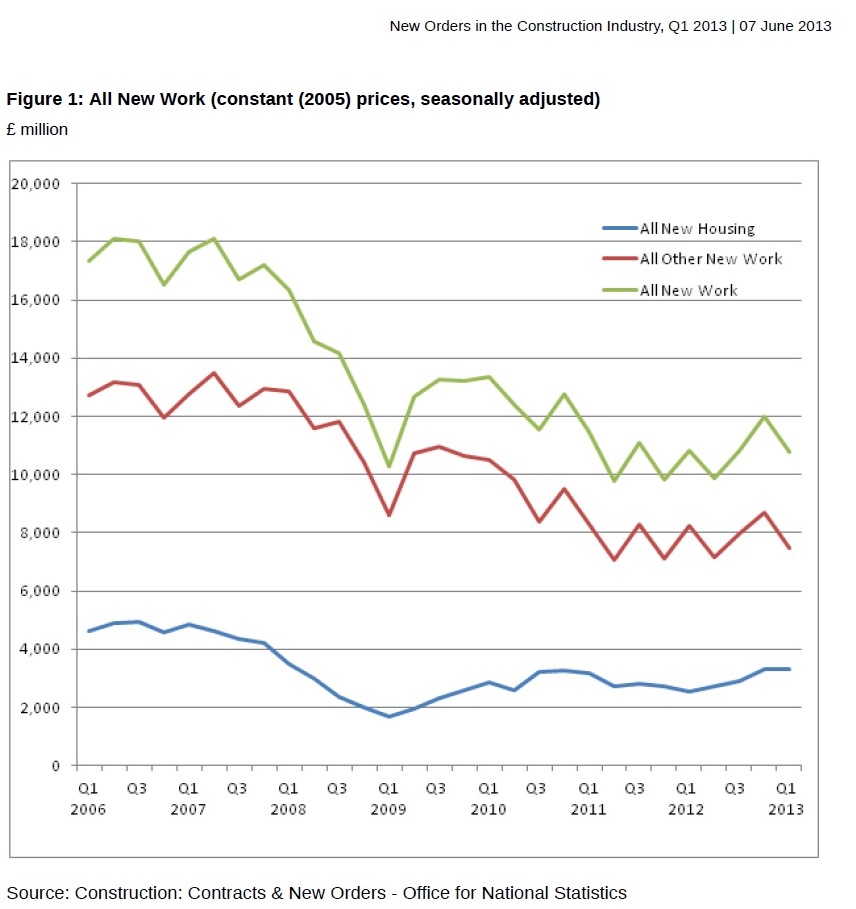
The value of new construction orders was down 10.0% on the previous quarter (Q4 2012) and down 0.2% compared with the same period a year before (Q1 2012).
The total value of new orders in Q1 2013 reached £10,793m. Of this, £3,319m was in new housing and £7,474m was in other new work.
The fall between Q4 2012 and Q1 2013 was attributable to a large decline in infrastructure which fell 49.8% (£1,600m) compared to Q4 2012. The components excluding infrastructure all showed positive quarter-on-quarter growth.
New housing showed a small increase in Q1 2013 of 0.2%. However, this minor increase ensures that new housing is at its highest level since Q1 of 2008. Comparing the year-on-year estimates, new housing shows an increase of 29.5% (£760m).
Alasdair Reisner, director of external affairs at the Civil Engineering Contractors Association (CECA), said: “It is important to exercise caution when dealing with a single set of figures, and it should be noted that these statistics do not necessarily reflect recent results of CECA’s own Workload Trends survey.
“Nonetheless, the sharp decline in new orders in infrastructure should create a degree of caution. The government have placed infrastructure at the heart of its growth strategy, and if these figures represent the beginning of a trend in falling orders and activity in the sector, this will put the UK’s economic recovery at risk.
“It is particularly worrying that it appears that workloads have fallen across all elements of infrastructure, including in the rail sector, which has prospered recently. Traditionally the first quarter has also tended to provide relatively strong orders in our sector, so today’s poor figures come as somewhat of a surprise.
“It is vital that all efforts are made to ensure that today’s numbers represent an anomaly, and that the sector returns to growth in orders as soon as possible, supporting employment in our sector and improvements in the wider economy.”
Dr Noble Francis, economics director at the Construction Products Association, said: “Recent GDP figures have pointed to signs of growth in the overall economy, but construction has continued to face very challenging conditions with output already 7% lower than a year ago. Today’s new orders figures reflect these continuing difficulties.
“Most encouraging were indications of growth in the private housing market. Government policies – particularly FirstBuy, Funding for Lending and the recently announced Help to Buy – are giving major house builders the confidence to build. Because private housing has a short time-lag between orders and output, these new orders should lead to a further rise in housing activity this year.
“Of greater concern, however, is the 50% drop in the infrastructure sector since the previous quarter and the 39% fall compared to Q1 last year. This came despite the government’s regular and enthusiastic pronouncements of support over the last two years, such as the Chancellor’s £5bn capital investment ‘boost’ in last year’s Autumn Statement, £20bn in new private investment in infrastructure and a further £5.5bn capital investment ‘boost’ in December.
“As we have previously highlighted, the government must do better at translating such infrastructure announcements into new orders and real activity on the ground. Those aimed at housing are clearly delivering a beneficial effect; infrastructure must match this if we are to have a sustained economic recovery.”
|
Table 1: Value of New Orders summary tables |
|||||
|
Quarterly constant prices seasonally adjusted |
Compared to Q1 2012 |
Compared to Q4 2012 |
Q1 2013 |
||
|
1. All New Work |
Percentage change |
£million |
|||
|
All New Work |
-0.2 |
-10.0 |
10,793 |
||
|
Total New Housing |
29.5 |
0.2 |
3,319 |
||
|
Total Other New Work |
-9.4 |
-13.9 |
7,474 |
||
|
1.1 New Housing |
Percentage change |
£million |
|||
|
All New Housing |
29.5 |
0.2 |
3,319 |
||
|
Public & Housing Associations |
39.7 |
-0.3 |
729 |
||
|
Private |
27.0 |
0.4 |
2,590 |
||
|
1.2 Other New Work |
Percentage change |
£million |
|||
|
All Other New Work |
-9.4 |
-13.9 |
7,474 |
||
|
Infrastructure |
-39.4 |
-49.8 |
1,570 |
||
|
Excl Infrastructure |
|||||
|
Public |
36.8 |
9.9 |
2,230 |
||
|
Private - Industrial |
-19.3 |
11.5 |
564 |
||
|
Private - Commercial |
-6.6 |
3.3 |
3,110 |
||
Got a story? Email news@theconstructionindex.co.uk