
Workload Trends Survey 2011
April 2011 Report on Results of the Supplementary Question on Trends in Civil Engineering Contractors' Costs
- Background and Methodology
- Recollection of Results from 2002 to 2006
- Reprise of the Results in 2007
- Reprise of the Results in 2008
- Reprise of the Results in 2009
- Reprise of the Results in 2010
- Evidence from CECA's Regular Workload Trends Survey
- Summary of the Results for April 2011
- Engineering Staff
- Administrative Staff
- Skilled Operatives
- Other (Semi- and Unskilled) Operatives
- Plant Hire
- DERV Fuel
- Gas Oil Fuel
- Aggregates
- Coated Stone
- Bricks and Clay Products
- Cements
- Ready Mixed Concrete
- Precast Concrete Products
- Steel for Reinforcement
- Steel for Piling
- Fabricated Steelwork
- Other Metal Products
- Plastic Products
- Timber
- Waste to Landfill
Background and Methodology
CECA’s first detailed investigation of trends in member contractors’ costs was carried out in October 2000. In a Special Question added to that month’s regular quarterly survey of civil engineering workload trends, contractors were invited to say what percentage change there had been over the preceding 12 months in the unit costs to them of purchasing and employing a total of 18 items – including human resources, materials and services – commonly used in civil engineering construction.
The Special Question was then repeated in the October workload trends surveys from 2002 to 2005, and in the April surveys in 2006 and 2007. The list of items was extended to 20 by the addition of Gas Oil Fuel in 2002 and DERV Fuel in 2005.
From 2000 to 2004 the number of member firms answering the Special Question was around 100, but in October 2005 and again in April 2006 it dropped to 85. It then picked up to 105 in April 2007 but slipped back to just over 90 in 2008. However, very few respondents give answers for all 20 items.
Initially it was hoped that it would be possible to provide separate results for different regions and differently sized contractors, but even when there were over 100 respondents this was not truly practicable for more than a very few items. Now the commentary gives only overall results, but where there is clear evidence of differences of experience by region or by size of firm this is mentioned in the text.
From the answers provided by member contractors, which (unlike those given to questions in the regular quarterly workload trends survey) are not weighted by size of firm, CECA calculates both average and median percentage changes in the cost of each item.
The Special Question matrix now has tick boxes offering contractors a range of 13 cost change options, from a fall of more than 5% to an increase of more than 20%. In between these extremes there are 10 intervening bands – eight up and two down – each of two and a half percentage points, and a ‘no change’ or ‘same’ option.
Contractors reporting increases of more than 20% or reductions of more than 5% are invited to indicate actual percentage changes to the nearest 5%.
Averages are calculated by giving each answer in any of the two-and-a-half point bands the mid-point value of that band – e.g. all answers in the band +5.1% to +7.5% are given the value +6.25%. Any indicating an increase of more than 20% or a reduction of more than 5% that do not give an actual value are counted as +21.25% or –6.25% respectively.
The most important point to note about the methodology of the CECA Special Question on cost trends, however, is that it asks contractors what has happened to the full costs to them of purchasing and employing each of the 20 items.
For costs of employing labour this means that they should take into account any bonuses and allowances, and changes in employers’ National Insurance contributions. For the costs of materials and services they should include any changes in discounts or rebates, or in haulage costs of materials delivered to or waste carried away from their sites.
Even where headings are identical, therefore, results from the CECA Special Question are not directly comparable with movements over the same period in official price indices that for labour and supervision take into account only nationally agreed changes in pay and conditions, and for materials and products are generally based on suppliers’ list prices applicable at the factory gate without any adjustment for discounts or rebates or delivery costs.
Recollection of Results from 2002 to 2006
The ultimate objective of the Special Question on cost trends is to produce an estimate of the average rate of inflation of civil engineering contractors’ costs across the whole industry, all types of work and all inputs; but the lack of any reliable breakdown of contractors’ costs across the whole civil engineering industry and all types of work means that it is not possible to use the information gathered by the CECA Special Question to produce an accurate measure of overall cost inflation.
However, using what appear to be reasonable assumptions, based on findings of other surveys carried out by CECA itself and other independent research into the division of total costs between labour costs and costs of materials, products and bought-in services, and regarding the composition of the workforce, it is possible to produce broad estimates.
2001-02
Analysis of the replies received in October 2002 suggested that the overall rate of inflation of civil engineering contractors’ costs over the preceding year was between +7% and +8%, more probably at the upper end of that range.
Contributing to this result were two substantial ‘shocks to the system’: the introduction of the Aggregates Levy in April 2002, and the sharp rise in the cost of Steel for Reinforcement following the collapse of leading UK supplier ASW in July. At the same time, however, of the other 17 items covered by that year’s Special Question there were only four the cost of which appeared to have risen less than 5%, and seven for which more than one in ten respondents reported increases of more than 15%.
2002-03
In October 2003 it was anticipated that the analysis would find a lower rate of cost inflation, not least because the rate of Aggregates Levy was not changed in Spring Budget 2003, and the price of reinforcement appeared to have stabilised at a somewhat lower level. On the other hand, answers to CECA’s regular workload trends survey question on cost trends were suggesting that labour costs in civil engineering were still rising at a relatively fast rate compared with other industries.
In the event, across the whole range of items both average and median reported rates of change in costs were much more closely grouped than a year earlier, most being in the range +3% to +5%. Also, not only was there no item for which as many as one in ten respondents indicated a rise of over 15% but there was none for which the proportion reporting a rise of 10% was as high as one in ten.
Thus, using the same assumptions as before about the structure of contractors’ costs across the whole industry, CECA estimated that the overall rate of cost inflation over the year to October 2003 was between +4.25% and +4.5%.
2003-04
In October 2004 the rate of cost inflation was found to have quickened again, to around double the rate for the previous year and a little ahead of the figure for the year before that. There was only one item – Plant Hire – for which the average rate of change of the cost to contractors over the preceding 12 months was found to be less than +5%. Only for this item and three others was the median change below +5%.
At the other end of the scale there were increases of +20% or more for all three Steel items; a +20% average increase of the cost of Other Metal Products; and other double-digit average rates of increase for Gas Oil Fuel and disposal of Waste to Landfill. For the last of these the median rate of increase also was in double figures.
There was also a remarkable rise in proportions of respondents reporting cost increases above +10%. In October 2003 the highest such proportion had been only 9%, but in October 2004 9% was the second lowest of the 19 figures, with only that for Plant Hire showing a lower proportion. For other items the ‘over 10%’ proportion was around a quarter for employment of Engineering Staff and of Skilled Operatives, and for Coated Stone, rising to around half for Gas Oil Fuel and disposal of Waste to Landfill, and as high as three quarters for all the Steel items.
A further ‘cut’ was made, therefore, of respondents reporting costs higher by more than +25%. This found there were no fewer than six of the 19 items for which the percentage was in double figures. These included all the Steel items, for all of which the ‘over 25%’ proportion was a third or more. For both Steel for Reinforcement and Steel for Piling it was nearly half.
Taking into account all these features of the October 2004 results, and using the same assumptions as before regarding the composition of contractors’ costs, CECA estimated that the rate of cost inflation experienced by its members over the year to October 2004 was somewhere between +8% and +9%.
2004-05
In October 2005 there were several items for which replies were more difficult to interpret than previously, because of a very wide and relatively thin spread of indicated values of the change in cost of these items over the preceding 12 months.
For example, for Gas Oil Fuel the spread was from no change to an increase of 50%, whilst for Steel for Reinforcement it was even wider, from a reduction of 33% to an increase of more than 25%. Written-in comments confirmed that costs of these and similar items had become very volatile.
It did appear, however, that the overall rate of inflation of contractors’ costs had been a little slower in 2004-05 than in 2003-04.
There were only four items for which the 2004-05 average change values were higher than those recorded a year earlier. Also, there were far fewer replies indicating increases of more than +10%, let alone more than +25%, than there had been a year earlier. Except for DERV Fuel and Gas Oil Fuel, the former of which was not included before October 2005, there were no double-digit percentages of replies indicating increases above +25%.
On the other hand, where across-the-board average and median values for the change in cost were lower in October 2005 than in October 2004 the differences - apart from those for Steel products - were not very large.
Using the same assumptions as before regarding the composition of contractors’ costs, CECA’s best estimate of the average rate of cost inflation experienced by civil engineering contractors over the year to October 2005 was that it had been between +6% and +7%, probably in the upper half of that range, which was two percentage points below the estimate for 2003-04.
2005-06
In 2006 the first regular workload trends survey, in January, recorded a sharp rise, from 20% to 44%, in the proportion of respondents reporting an acceleration of the rate of inflation of their costs. In response to this CECA’s Council, at its meeting in March, decided that the next asking of the Special Question on cost trends should be brought forward from October to April.
As in October 2005 this found a number of items for which the spread of indicated values for the change in costs over the preceding 12 months was very wide and relatively thin, making interpretation difficult. However, there were not so many contractors reporting very large increases.
Six months earlier the highest proportion of all respondents reporting the cost of any item increased by more than 25% was 23% for Gas Oil Fuel. In April 2006 it was only 8%, also for Gas Oil. At the same time the highest proportion indicating and increase of more than 10% in the cost of any item was down from 64% to 49%.
Comparing the April 2006 results with those obtained in October 2005, the rate of increase of labour costs showed very little change, whilst the rate of increase of costs of fuel appeared to have been a little slower than previously.
On the other hand, the rate of increase of costs of materials appeared to be at least a little higher for every materials item in the matrix.
Netting out all the changes, using the same formula as before, CECA’s best estimate was that the rate of inflation of civil engineering contractors’ costs generally over the 12 months to April 2006 was between +6.5% and +7.25%.
In preparation for the 2007 asking of the Special Question CECA reviewed the assumptions or ‘rules of thumb’ that it employs to produce its estimate of the across-the-board rate of inflation of civil engineering contractors’ costs, then re-estimated the rate for the year to April 2006. The revised answer was still in the range +6.5% to +7.25%, but tending more towards the bottom end of that range than in the initial calculation.
Reprise of the Results in 2007
Special Question Summary 2007
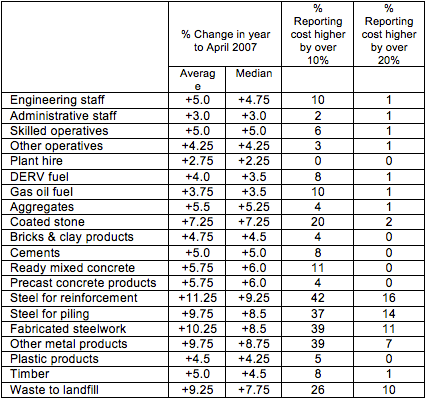
- In 2007 the survey indicated that costs were generally rising less rapidly than in the previous twelve months , with the exception of Steel products and Timber.
- The downward movement was exemplified by the lower proportion of respondents indicating increases of more than 10%, although the proportion reporting rises of more than +20%, apart from those for Steel products, showed very little change.
- A key feature of the 2007 results was the reduction in the rate of increase of all four types of labour cost examined by the survey compared with the previous year. This was reflected in turn by other cost elements.
- On the basis of the survey findings CECA estimated that the rate of cost increase over the year to April 2007 was in the range +5% to +5.5%.
Reprise of the Results in 2008
Special Question Summary 2008
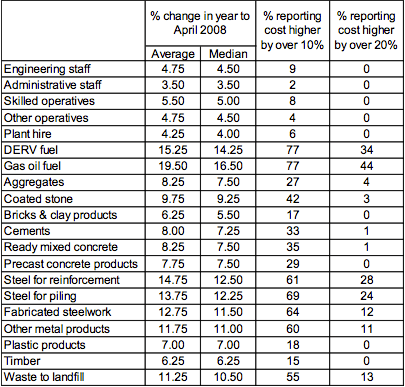
- The 2008 Special Question showed that contractors were indicating an increase in the rate of inflation of their costs between 2006-07 and 2007-08.
- In 2008 the only item to show a lower rate of change than in 2007 was Engineering Staff.
- Cost increases were pervasive in 2008. Double-digit rises were reported by more than ten percent of the sample for fifteen of the twenty cost categories covered by the survey.
- Fuel costs through DERV and Gas Oil gave a major impetus to the cost rises, each increasing by 15%-20%.
- This data enabled CECA to calculate that overall cost inflation in the period to April 2008 was of the order of +7.0 to 7.75%.
- Examining the data for Scotland suggest that cost inflation there was running at about three percentage points higher than in England.
Reprise of the Results in 2009
Special Question Summary 2009
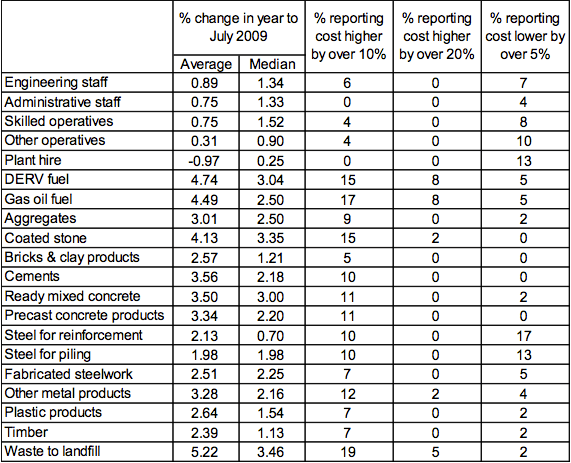
- Overall, the 2009 Special Question clearly brings out the very different cost inflation picture in 2009 compared with the previous year – cost increases have become less pervasive and significantly lower.
- Of the 20 cost categories examined by the survey 11 had reports of cost increases of over 20% in 2008. A year later only five categories had reports of increases of over 20%. Three of the remaining main drivers of higher costs – DERV Fuel, Gas Oil Fuel and Waste to Landfill are influenced substantially by factors beyond the construction cycle.
- As in previous years the rate of increase in labour input costs is lower than that for materials. Average rises for Engineering Staff, Administrative Staff, Skilled Operatives and Other Operatives were all below 1%. Reports of decreases in these categories were no longer exceptional.
- Plant hire costs were the only element to record a negative average, falling by 0.97% with 13% of the sample recording reduction in excess of 5%.
- The results also show that there is a tendency, not applicable to all categories, for the rate of cost inflation to remain higher in Scotland than England.
Reprise of the Results in 2010
Special Question Summary 2010
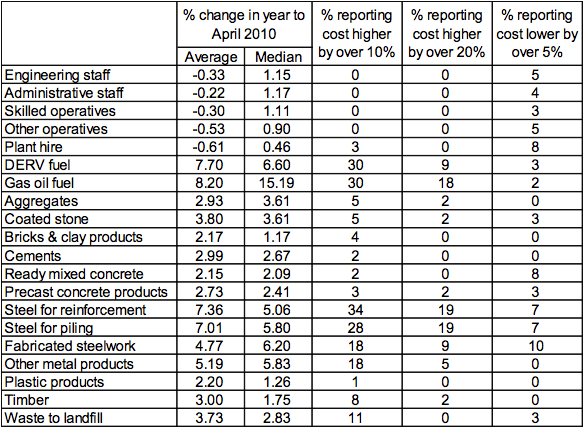
- In April 2010, inflationary pressures moderated considerably across a number of cost categories, compared with July 2009, largely reflecting the spare capacity available.
- 10 categories out of the 20 cost categories reviewed, had reports of price increases higher than 20% in April 2010, relative to only five categories in 2009.
- Pressure on fuel and metal prices increased in the year to April 2010 as global demand for commodities strengthened driven by the wider global economic recovery. Inflation in the price of both DERV fuel and oil and gas fuel exceeded 10% for over 30% of respondents and it was greater than 20% for 9% and 18% of respondents respectively.
- Strengthening demand from emerging economies fuelled rapid steel price inflation and the cost of steel for reinforcement and steel for piling rose sharply for many respondents in the 12 months to April 2010 compared with July 2009. 34% of contractors reported that the cost of steel for reinforcement increased by more than 10% and 28% suggested that the change in the price of steel for piling was equally strong.
- Labour costs, however, declined on average between April 2009 and April 2010 according to CECA members.
Evidence from CECA’s Regular Workload Trends Survey
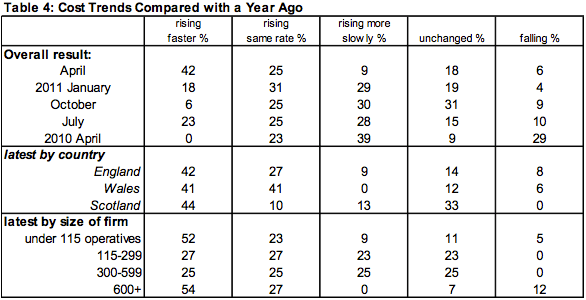
Between the Special Question in April 2010 and the one conducted in April 2011 there were three CECA surveys of civil engineering workload trends that included the regular question on cost trends that has been part of the questionnaire continuously since the survey was launched in March 1997. This asks contractors to indicate whether their costs are rising faster, rising at the same rate or rising more slowly than they were a year earlier, or are unchanged from or lower than a year ago.
The past three survey results show that cost inflation has accelerated annually, despite the challenging trading conditions. The proportion of contractors participating in CECA’s Regular Workload Trends Survey reporting falling costs has consistently declined since the Trends in Civil Engineering Contractors’ Costs Survey in April 2010 and an increasing number of companies are indicating that costs are rising at a faster or same rate compared to a year ago. In April 2011, there was a noticeable strengthening in cost inflation and 42% of firms stated that costs were increasing at a faster than 12 months ago. Only 18% of respondents reported that costs were unchanged relative to a year ago, whilst costs increased for 76% of respondents.
Regular Workload Trends Survey
Cost Trends Compared with a Year Ago
Summary of the Results for April 2011
Detailed results from the Special Question on cost trends asked in association with the April 2011 regular CECA survey of civil engineering workload trends are set out in the table.
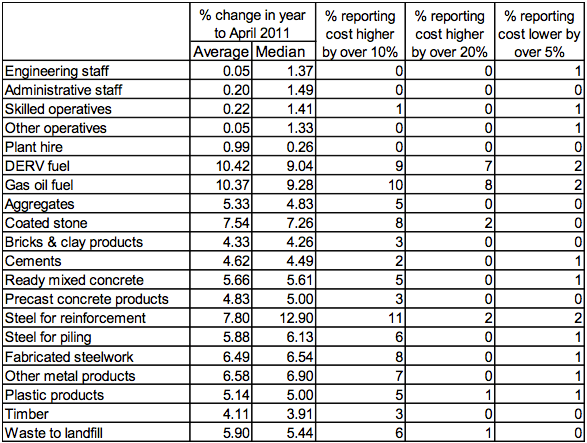
The Special Question results fill in the detail on cost elements giving a more complete picture than the cost trends question in the main survey.
- Compared to April 2010, inflationary pressures on costs intensified across the majority of categories, whilst labour cost inflation was moderate if not flat relative to the pre-recession years.
- Of the 20 cost categories examined by the survey six had reports of cost increases of over 20% in 2011 compared to 2010, when inflation at such a rate was reported in ten categories.
- Fuel costs and metal prices, particularly for steel, have been under pressure as global demand strengthened during 2010. In the year to April 2011, inflation in the price of both DERV fuel and oil and gas fuel exceeded 10% for over 40% of respondents and it was greater than 20% for 18% and 19% of respondents respectively.
- Strengthening demand from emerging economies combined with supply restrictions of iron ore from Australia due to flooding, and change to quarterly rather than annual pricing contracts for iron ore have fuelled rapid steel price inflation since the previous trends in contractors’ costs. Thirty-three per cent of contractors reported that the cost of steel for reinforcement increased by more than 10% and 20% suggested that the change in the price of steel for piling was equally strong.
Engineering Staff
The short tables in this and the subsequent sections of the commentary show for each item the percentages of replies received from contractors for each of the offered cost change options.
66% of 53 responding firms witnessed no change in the cost of employing engineering staff between April 2010 and April 2011. 21% of respondents experienced an increase in the payroll cost of engineering staff in the 12 months to April 2011, but for the majority of these the increase was less than 2.5%. Costs declined for 14% of respondents, but deflation was modest and for 8% of firms prices fell by 2.5% or less.
Labour cost inflation averaged 4.8% in 2008, but as the industry fell into recession and the labour market weakened, this slowed significantly to 0.9% in 2009. In 2010 costs were less of a concern and, on average, costs declined by 0.3%, whilst in the 12 months to April 2011 the cost of employing engineering staff was broadly unchanged.

The majority of respondents across all nations suggested that employment costs were unchanged, but falling rates for engineering staff were most prominent in England.
Administrative Staff
Out of 53 responding firms, 70% said that the cost of employing administrative staff over the 12 months to April 2011 did not change. 8% of all respondents reported that the cost had fallen, but for 23% of survey participants labour costs increased, however, the majority of increases were modest at less than 2.5%.
On average, the cost of employing administrative staff increased by 0.2% in the 12 months to April 2011 in contrast with a decline of 0.2% in 2010. This is still significantly lower than the 3.5% recorded in 2008 and less than an average of 0.75% in 2009.

Lower wages for administrative staff were also most widely reported in England, although 65% of English respondents suggested that rates were unchanged during the year. In Scotland 73% of respondents also reported that costs were stable.
Skilled Operatives
Of the 52 contractors that provided information 65% reported no change in the cost of skilled operatives between April 2010 and April 2011, but on balance, the proportion of contractors reporting a change suggested that costs increased. For the majority of respondents reporting an increase, however, the rise was modest, at less than 2.5%.

Once again employment costs were more likely to have fallen in England than elsewhere during the year.
Other (Semi- and Unskilled) Operatives
Thirty-six out of the 51 firms (71%) reporting their rate of inflation over the past year when employing other operatives suggested that costs were broadly unchanged. 16% of respondents suggested that costs increased by up to 2.5%, while 12% reported falls in labour costs.

The cost of other operatives was reported to have fallen by 18% of English contractors. In contrast, 18% of Scottish contractors reported that the cost of other operatives increased during the year.
Plant Hire
Historically plant hire has shown the least cost inflation of any of the inputs monitored by the CECA survey, however, in the 12 months to April 51% of respondents experienced an increase in plant hire inflation. 15 out of 53 firms (28%) reported a rise in costs for up to 2.5%, whilst 9% of respondents reported that plant hire costs increased by between 5.1% and 10%.

Plant hire costs were reported to have fallen between April 2010 and April 2011 by 15% of contractors in England and by 9% in Scotland, however, increases in the cost of hire were reported by 50% and 55% of companies respectively.
DERV Fuel
DERV fuel prices increased by an average of 10.4% in the year to April 2011, and 18% of respondents reported that inflation exceeded 20%, highlighting the strong impact rapid inflation in fuel prices has had on the civil engineering sector. (oil prices increased by 29% in 2010).

In Scotland 100% of contractors reported that the cost of DERV oil increased in the year to April 2011, whilst 94% of the surveyed companies experienced a rise in England. For the majority of English firms inflation ranged between 2.6% and 15%, but for a not insignificant proportion, inflation was considerable stronger. In Scotland, over 60% of respondents indicated that DERV fuel price inflation ranged between 5.1% and 10%.
Gas Oil Fuel
Annual inflation accelerated to 10.4% in April 2011 for gas oil fuel from 8.2% in April 2010. 23% of firms reported that costs increased by between 7.6% and 10%, whilst a significant proportion of respondents, 19% throughout Great Britain, reported that inflation exceeded 20% during the year.

In England and Scotland, the proportion of respondents reporting cost inflation in excess of 20%, was 16% and 30% respectively. Average inflation rates for the two nations were 9.3% and 8.8% respectively.
Aggregates
Aggregates cost inflation accelerated from April 2010 in April 2011, rising from 2.9% to 5.3%. Only 9% of 47 respondents suggested that costs were unchanged over the period, compared to 23% of the 126 responses in April 2010. 87% of the surveyed firms experienced inflation in aggregates prices and for 30% of respondents, prices increased by between 2.6% and 5%. Inflation was stronger at between 5.1% and 10% for 36% of respondents.

The rate of inflation in aggregates rose somewhat from April 2010 and was 5.1% in England and Wales, while in Scotland it was slightly higher at 6.1%.
Coated Stone
The rate of inflation in coated stone prices nearly doubled in the year to April 2010 and inflation equalled 7.5%, compared to 3.8% a year ago. 88% of all respondents reported increases in prices, whilst only 12% experienced no change or a fall in prices. Prices rises between 5.1% and 10% were witnessed by 48% of respondents.

Coated stone price inflation was broadly similar across the nations and, on average, prices increased by 7.5% in the three nations. This is a significantly higher than price inflation reported in April 2010, when, on average, inflation in England was 4.2%, while in Scotland it was 3.6% and in Wales only 3.1%.
Bricks and Clay Products
Out of the 39 contractors who provided information on the change in the cost of bricks and clay products, only 13% reported that costs were unchanged over the year, compared to 33% of 104 respondents in April 2010. Prices reduced for 8%, but price rises were reported by the majority, with increases of up to 7.5% being reported by 64% of respondents.

The spread of replies received in respect of bricks and clay products was relatively narrow for the fourth consecutive year. Inflation was highest in England and Wales, where prices increased, on average, by 4.4% compared to the average price inflation of 4.1% in Scotland.
Cements
Cements price inflation picked up from April 2010. Only 7% of all respondents experienced a contraction in cement prices, whilst over 90% of firms encountered price increases in the year to April 2011. For the majority of these firms increases were between 2.6% and 5%.

The picture across the nations was broadly similar in April 2011 and, on average, cement prices increased by 4.6% in Scotland and by 4.3% in England, higher than in April 2010 when prices rose by 3% and 3.1%, respectively.
Ready Mixed Concrete
Price inflation for ready mixed concrete accelerated considerably in the 12 months to April 2011 and while costs declined for 19% of respondents in April 2010, the latest survey data suggest that cost rises of ready mixed concrete were witnessed by 96% of firms. On average, prices increased by 5.7% in Great Britain.

Cost pressures were broadly similar across the nations, the majority of respondents reporting price rises. On average, ready mixed concrete prices increased by 5.3% in Scotland and by 5.7% in England in April 2011.
Precast Concrete Products
Out of the 41 contractors who reported on the cost of precast concrete products, only 7% suggests that costs decreased or were unchanged compared to April 2010, whilst the majority (78%) reported that costs rose between 0.1% and 7.5% compared to a year ago. On average, price increases of 4.8% were reported across all respondents.

There was little variation between responses from contractors across the nations. In each instance more than 85% of contractors reported that prices increased over the period, however, proportionally fewer English respondents experienced inflation than contractors elsewhere.
Steel for Reinforcement
Steel prices have soared over the past 12 months (driven by iron ore and coking coal prices) and this is reflected in the latest survey responses as the majority of respondents experienced an increase in steel reinforcement prices in April 2011 and, on average, prices rose by 7.8% broadly similar to April 2010 when inflation equalled 7.4%. Over half of firms reported that prices rose by between 5.1% and 12.5%, however, only 5% of the surveyed companies indicated that inflation exceeded 20%.

Steel for reinforcing costs increased robustly for the majority of contractors in the year to April 2011. In Scotland, all of the surveyed firms reported rising steel enforcement costs, whilst in England 85% of companies experienced inflation.
Steel for Piling
On average, cost inflation of steel for piling was lower than the steel for reinforcement. 67% of respondents reported that costs increased by 10% or less in the year to April 2011, yielding an average cost rise of 5.9%. Steel for piling prices declined or were unchanged for 13% of firms. Thirty responses concerning steel for piling were received.

The rising cost of steel for piling was particularly prominent in Scotland, affecting all of respondents over the 12 month period. In England and Wales, however, the proportion of respondents reporting an increase was still high and 84% of firms witnessed inflation.
Fabricated Steelwork
Twenty-eight out of 32 respondents reported that the cost of fabricated steelwork increased in the year to April 2011. There was a considerable variation in responses, however, the majority of firms reported that price increases ranged between 2.6% and 12.5% and, on average, prices rose by 6.5% in April 2011.

Increases in fabricated steelwork prices were reported widely throughout England, Wales and Scotland. Costs were higher for eighty-nine per cent of firms in England and Wales, whilst 80% of Scottish firms experienced price inflation in the cost of fabricated steel work.
Other Metal Products
In the previous CECA surveys, inflationary pressure on other metal products has been more moderate compared to steel prices. However, on average, other metal product prices increased by 6.6% in April 2011, in line with materials price inflation for steel products. Only 13% of firms stated that prices fell or were unchanged during the year, compared to % in April 2010, whilst 87% witnessed inflation in other metal product prices.

All Welsh respondents indicated that the price of other metal products increased in the year to April 2011, whilst the corresponding figures were 86% and 71% for England and Scotland respectively.
Plastic Products
A total of 37 contractors provided information on the change in cost of plastic products. Only 16% of contractors reported that costs were either lower or unchanged in April 2011 than they had been in April 2010. Nearly 50% of firms reported that the cost of plastic products increased by between 2.6% and 7.5%. On average, plastic products prices increased by 5.1%, double the rate compared to one year earlier when, on average, prices increased by 2.2%.

The cost of plastic products rose strongly throughout Great Britain in the 12 months to April 2011. Seventy-one per cent of Scottish and 89% of English respondents reported that costs increased, whilst all companies operating in Wales witnessed inflation.
Timber
The majority of surveyed CECA members reported that the cost of timber increased in the year to April 2011 and only 15% of companies suggested that prices were either stable or lower than in 2010. Over half of respondents indicated that price inflation ranged between 2.6% and 7.5%, while a further 21% suggested that inflation ranged between 0.1% and 2.5%. The average rate of inflation was 4.1% in the year to April 2011, over one percentage point stronger than an average of 3% in the year to April 2010.

Pressure on timber prices was felt unanimously across Great Britain, whilst price increases were more modest in Scotland where 75% experienced an increase in timber prices. In England, 83% of respondents reported that the cost of timber increased between April 2010 and April 2011 and not a single respondent reported that prices fell or were unchanged in Wales.
Waste to Landfill
Of the 42 contractors providing information about their waste to landfill costs, 14% suggested that cost of disposing of waste in landfill was unchanged in April 2011 when compared to April 2010. Once again costs rose for the majority of contractors and, on average, firms’ waste disposal costs increased by 5.9% in April 2011 compared to 3.7% in April 2010. 19% of respondents experienced inflation between 0.1% and 2.5% or 7.6%-10%, whilst only 5% stated that costs fell in last 12 months.

Pressure on waste to landfill costs affected 85% of firms in England and Wales, whilst 88% of Scottish contractors reported that waste to landfill costs increased in the year to April 2011.