
After many months of sustained growth, it seems clear now that the UK construction sector paused for breath as autumn cooled into winter. Even the continued success of our triumphant house builders failed to prevent a 2% dip in November output compared to October 2014, although the level was still 3.6% ahead of November 2013 according to the Office for National Statistics. This softening trend was also confirmed by the Markit/CIPS Construction PMI index reading of 57.6 for December. This index had been showing figures of 60+ for most of 2014, having peaked at 64.2 in September 2104.
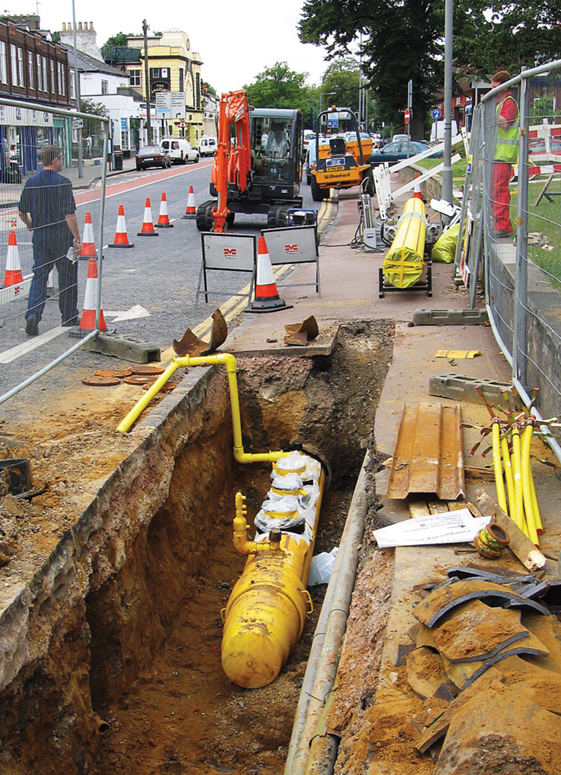
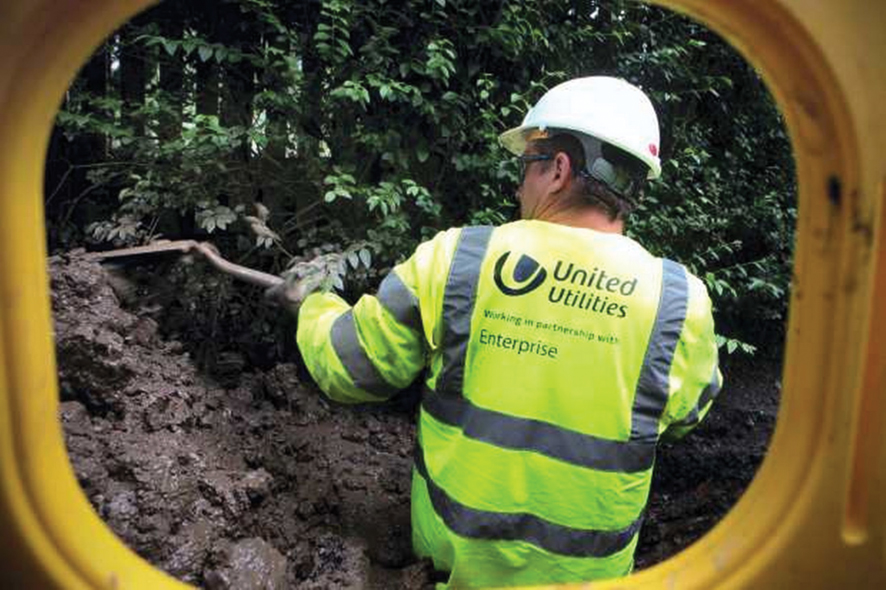
Nevertheless, despite this recent slowing a study by economists from market research firm Leading Edge published in January predicts that construction output will rise by 4.2% in 2015 and by 3.7% in 2016. Inevitably, housebuilding is expected to be the main driver, supported by steady growth in repair and maintenance activity. But what about the water and utilities sector? Just as at the time of our last look at this specialist area a year ago, whatever may be happening in the industry as a whole, the short and medium term prospects for contractors relying primarily on projects in the water, gas, electricity and telecommunications industries will be influenced by a number of unique factors which are not connected with the performance of the UK economy as a whole.
Public concern is at fever pitch over the apparent failure of consumer energy prices to reflect the precipitate fall in wholesale energy prices - most crucially the more than halving of benchmark oil prices in just a few months. Energy suppliers have been strongarmed into a shambolic and uncoordinated dash to cut electricity and gas bills, which so far has gone nowhere close to stopping the deluge of media harassment they are experiencing on this issue.
The effect on energy supply company investment over the short and medium term is hard to discern amid this febrile atmosphere. For while energy prices have slipped, the high profile of flooding events over the winter of 2013/14 is dictating a far higher level of investment in flood defences and water management than that anticipated after the sharp budget cuts which were supposed to be imposed on the Environment Agency as part of the government’s deficit reduction programme.
The companies we analysed for this month’s report are those with turnover of £15m or more in their latest published accounts. The sample totalled 24 UK-based companies and wherever possible we have taken our data from a specific independent company or a group subsidiary specializing in utility or water contracting.
The Company Watch data extracted from the published accounts of these companies shows that profit levels have jumped from a slim 1.8% twelve months ago to a far healthier (if still slim) 3.8% of reported turnover now. This has propelled them up to third place in the sector league table, beaten only by plant hirers (14.9%) and house builders (12.8%). Their return on capital employed is also far higher; it is now 21% compared to only 12% last year. On this measure they are also in third place in the league, this time behind road builders and plant hirers, both of which earn 26% on their capital.
The trade-off between risk and reward varies wildly across the construction industry, particularly when profits and borrowing levels are compared. For utility and water contractors, the percentage of debt to capital employed (gearing) is at an abnormally low level of just 6%, still the lowest of all the sectors we have reviewed so far even if it has edged up slightly from last year’s 5%. At the other end of the scale, plant hire companies have to earn higher profits to compensate for their 79% gearing. Remarkably, almost half of our sample (11 companies) have no third-party borrowings, although some enjoy internal funding from their parent entities.
Utilities & Water Contractors
| Company name | Total assets £m | Total debt | Net worth | Annual sales £m | Pre-tax profit £m | Financial health score (Max 100) |
| Murphy pipelines | 12.5 | 0 | 9.2 | 17.4 | 5.4 | 95 |
| Bsg civil engineering | 33.7 | 1.2 | 24.2 | 28.6 | 5 | 94 |
| VBMS | 44.3 | 0 | 18.5 | 97.2 | 35.3 | 91 |
| Peter duffy | 18.4 | 1.1 | 12.6 | 38.3 | 4.6 | 86 |
| Morrison utility services | 246.6 | 0.4 | 116.8 | 518.4 | 19.3 | 78 |
| Excalon | 8.8 | 0.7 | 2.9 | 27.6 | 1.2 | 71 |
| BTS group | 10.3 | 0.8 | 2.9 | 43.3 | 2 | 68 |
| Martifer solar uk | 24.3 | 0 | 3.5 | 34.9 | 4.4 | 64 |
| JSM construction | 15 | 2.2 | 3.9 | 30 | 1.4 | 62 |
| Cheetham hill construction | 16.7 | 2.2 | 7.6 | 29.4 | 1.7 | 61 |
| NIE networks services | 45.0 | 0 | 11.6 | 61.2 | 1 | 57 |
| Biwater holdings | 76.4 | 0 | 16.2 | 60.5 | 3.1 | 56 |
| J.N. bentley | 43.9 | 1.3 | 14.2 | 119.1 | 4.3 | 56 |
| Jackson civil engineering group | 27.1 | 0 | 3.9 | 68.2 | 1.1 | 56 |
| Lewis civil engineering | 15.4 | 3.6 | 3.7 | 27.7 | 1.1 | 54 |
| Clancy docwra | 71.1 | 3 | 15.6 | 262.4 | 3 | 51 |
| Ovivo uk | 47.8 | 0 | 22.9 | 43.6 | -1.3 | 50 |
| Dawson-wam | 17.8 | 2.7 | 8.3 | 25.1 | 0.3 | 49 |
| Xylem water solutions uk | 130.6 | 0 | 53.2 | 113.4 | 1.7 | 49 |
| Barhale | 39.4 | 4.4 | 7.5 | 120.3 | 4 | 47 |
| Interserve industrial services | 58.5 | 0.1 | 12.2 | 127 | -3.4 | 43 |
| Black & veatch | 101.1 | 0 | 37.6 | 226.5 | -7.5 | 41 |
| MWH constructors | 97.8 | 0 | 12.3 | 157.8 | -0.6 | 34 |
| Damar group | 7.3 | 0 | -1.8 | 15.6 | 0.1 | 12 |
| Totals | 1209.8 | 23.7 | 419.5 | 2293.5 | 87.3 | |
| Averages | 50.4 | 1 | 17.5 | 95.6 | 3.6 | 59 |
| Average gearing ratio | 6% | |||||
| Average profit margin | 3.8% | |||||
| Return on capital | 21% |
Sector Comparisons
| Profit margin | Return on capital | % gearing | % with no borrowings | Average health score | % in warning area | |
| Scaffolding contractors | -4.4% | -21% | 51% | 21% | 54 | 26% |
| Demolition contractors | 3.6% | 15% | 39% | 16% | 49 | 4% |
| Road builders | 3.2% | 26% | 31% | 34% | 56 | 8% |
| Commercial contractors | 1.8% | 13% | 17% | 50% | 52 | 5% |
| M&E contractors | 1% | 7% | 7% | 60% | 52 | 9% |
| Plant hirers | 14.9% | 26% | 79% | 4% | 59 | 8% |
| House builders | 12.8% | 16% | 14% | 20% | 50 | 26% |
| Utilities & water contractors | 3.8% | 21% | 6% | 46% | 59 | 4% |
Looking at the overall financial health of our 24 utility and water contractors, we find an average H-Score of 59, which is significantly above the norm of 49 for all UK companies of similar size and a major improvement on the average of 56 for this sector in our research last year. The low levels of debt play a major part in this outcome, as does the absence, with one minor exception, of any companies with negative net worth (liabilities greater than their assets). This is the equal highest average reading of the eight sub-sectors we have analysed previously for The Construction Index, matched only by plant hirers.
Additionally, the good news is that only one (4%) of our 24 contractors is in the Company Watch warning area, again the equal best result on this test alongside demolition contractors. Across the economy as a whole, the expectation would be that around 25% of any sample would be in this financial twilight zone. Looking at the better performers, 67% of the sample have HScores of 51 and above, as compared to around 50% for all UK companies. As noted above, just one has negative net worth and whilst four are loss-making, none is significantly in the red.
The results of our research are certainly encouraging, but it is worth repeating yet again our constant mantra from previous reports; this analysis covers only the major players in a market that also features smaller, generally undercapitalised and almost exclusively family-owned SMEs, often operating within the potentially abusive relationship of subcontractor to a more powerful and far bigger main contractor. Their prospects are inevitably far more precarious.
One of the realities of any growth phase after a recession is that insolvencies have peaked after every previous major recession for the past 40 years somewhere between 15 and 18 months after a sustained level of recovery takes hold, as it has done now. The counter-intuitive reason is that survivor companies burn through their reserves during the recession and then struggle to raise the extra working capital they need to fund increased sales and investment because loss-scarred banks have less lending capacity, especially for smaller borrowers. The onset of this phenomenon has been delayed in the aftermath of the latest recession because of an extended period of unprecedentedly low interest rates and the unwillingness of major stakeholders to crystallise losses. Even so it would be foolhardy to assume that a rise in failures is not out there waiting to ambush the commercially unwary.
There is no doubt that our major utility and water contractors are in better financial shape than they were a year ago. Despite this, their management must be wondering what the future holds for them. There are still many uncertainties, most of which are outside their control; not least the outcome of the looming General Election and the risk that the hostile policy promises of at least one major party may change the sector’s commercial landscape. Will profits continue to flow at last year’s improved rate? Will they be able to maintain the ultra-low borrowing business model, which serves them so well in financial risk terms? As always in the complex world of construction, the outcome depends on influences that are as unpredictable as the weather.
Got a story? Email news@theconstructionindex.co.uk