
The numbers indicate that the government’s austerity measures are starting to bite in the construction industry, according to the Royal Institution of Chartered Surveyors’ Building Cost Information Service (BCIS).
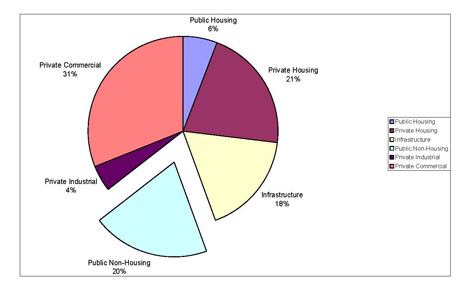
The public non-housing sector still represented a significant proportion of total new construction orders in 2011, at 20%, as shown in Figure 1, down from 26% in 2010.
Figure 1. Construction Orders 2011, Constant 2005 Prices (Seasonally Adjusted)
The fall in construction orders is mirrored by a fall in the annual percentage change in output in this sector, as shown in Figure 2.
Figure 2. Public Non-Housing Orders and Output, Constant 2005 Prices (Seasonally Adjusted) Annual Percentage Change

The table below shows that orders in the public non-housing sector started to fall in 2nd quarter 2010, but only fed through to falling output in 2nd quarter 2011.
Public Non-Housing Orders and Output, Constant 2005 Prices (Seasonally Adjusted), Annual Percentage Change
|
Orders |
Output |
|
|
1Q10 |
+39.6% |
+38.7% |
|
2Q10 |
-9.2% |
+41.1% |
|
3Q10 |
-35.7% |
+32.9% |
|
4Q10 |
-3.2% |
+16.9% |
|
1Q11 |
-22.0% |
+7.7% |
|
2Q11 |
-43.2% |
-5.9% |
|
3Q11 |
-21.3% |
-9.8% |
|
4Q11 |
-52.4% |
-16.3% |
|
1Q12 |
-41.5% |
-20.3% |
Got a story? Email news@theconstructionindex.co.uk

