
Those heady days of early-mid 2014 seemed to bring nothing but positive news from right across the construction world, led of course by its burgeoning house builders. Now a grimmer reality is emerging with a slew of profit warnings from leading contractors and most recently a couple of high-profile failures.
Balfour Beatty, which only last autumn rejected the merger aspirations of rival Carillion, has just reported the worst-ever financial performance by a UK construction company, with pre-tax losses of £304m. This followed hard on the heels of a negative outcome from the UK construction division of ISG, which had incurred the lion’s share (£16m) of a group first-half loss of £20.8m. Carillion itself admitted that it was having to decline some work opportunities to protect its overall profit margins.
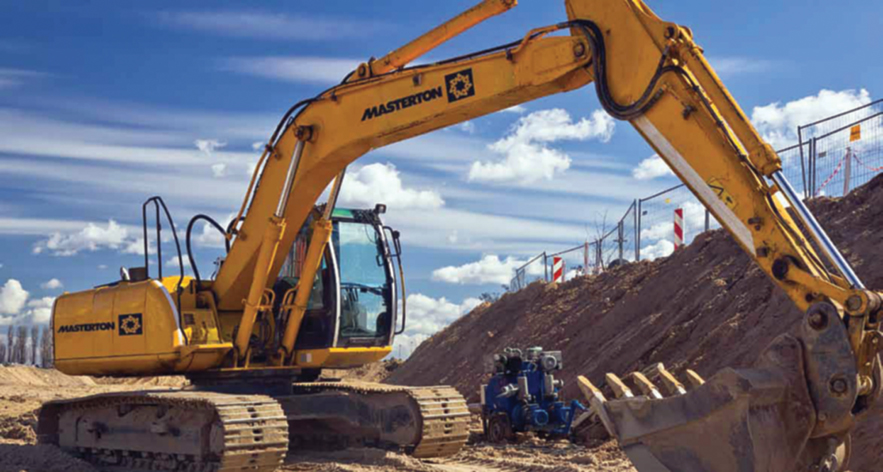
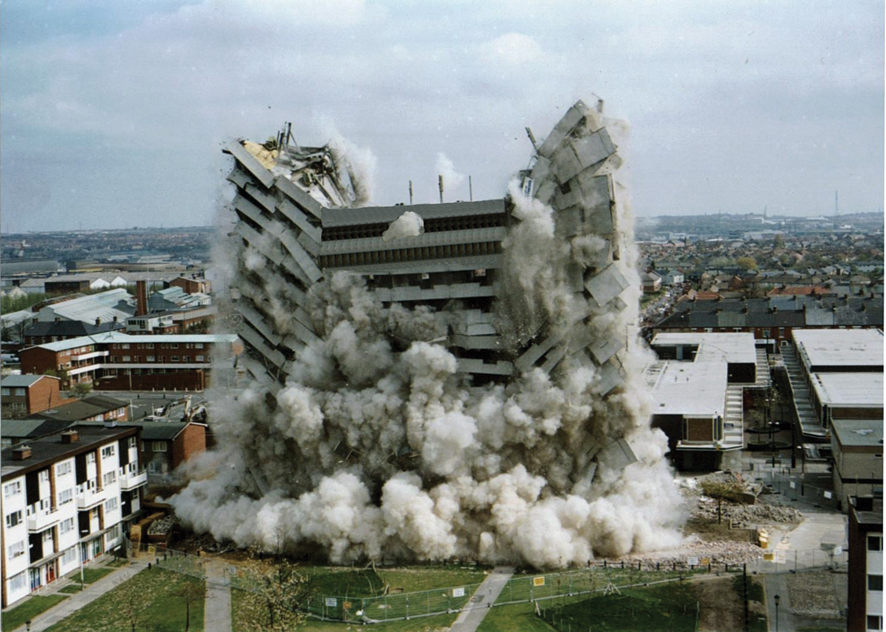
In between these pieces of bad news came the collapse into administration of GB Group, which had been created by the management buyout in 2005 of the building divisions of Gleeson. Attempts to rescue the business had failed after three major claims on contracts had led to escalating trading and cash-flow problems. Some 350 staff were laid off, leaving just a small number working to assist the administrators. These various woes appear to have stemmed from excess competition, which led to lowball pricing as workloads started to rise again after the impact of the global financial crisis in 2008 finally abated. Most recently, input prices for materials and labour, combined with growing skills shortages, have further trimmed already wafer-thin margins. Most contractors have badly-priced and badlymanaged contracts within their operations; sadly for some this is proving terminal. The demolition sector itself has now seen its first major casualty: Masterton fell into administration on 9th March. The company had grown its turnover from £10m in 2011 to £16m in 2012 and had been heading for a figure of £25m in 2013 before problems began to emerge with the profitability of some of the major contracts that had driven this explosive expansion.
This all comes at a time when construction output is patchy, rising some months but also falling as it did in January 2015, when according to the Office for National Statistics output was 2.6% lower than in December 2014 after a marginal 0.6% increase that month. Compared to a year earlier, January output was 3.1% down. The uneven pattern seems to have continued in February, when the Markit/CIPS Purchasing Managers’ survey produced a raised reading of 60.1 and indications of the fastest increase in new orders since October 2014. The companies we have analysed for this month’s report are those demolition contractors with turnover of £3m or more in their latest published accounts. Companies House records show that there are over 700 UK-registered companies claiming that their principal activity consists of demolition work. Even setting the turnover cut-off point as low as £3m still only produced a sample of just 25 companies, including one (S Evans & Sons) which has moved to publishing abbreviated accounts that do not disclose turnover but which we believe has a turnover figure within the sample size range.
Demolition Contractors
| Company name | Total assets £m | Total debt £m | New worth £m | Annual sales £m | Pre-tax profit £m | Financial Health Score (Max 100) |
| S Evans & Sons | 12 | 0 | 11.2 | 0 | 0 | 95 |
| John Tinnelly & Sons | 6.4 | 1.3 | 4.4 | 7.2 | 0.2 | 80 |
| DSM Group | 129.3 | 0.3 | 20 | 21.6 | 1.5 | 75 |
| Colard Group | 10.7 | 1.9 | 6.4 | 15.8 | 1.3 | 72 |
| Erith Contractors | 21.1 | 0 | 8.7 | 68.7 | 1.6 | 70 |
| Techincal Demoltion Services | 7.3 | 1.1 | 5.2 | 6.9 | 0.4 | 70 |
| Cantillon | 6.8 | 0.2 | 3.6 | 13.6 | 1 | 67 |
| Masterton | 10.1 | 0.9 | 4.7 | 13.1 | 1.2 | 67 |
| Coleman & Co | 14.5 | 2.4 | 6.8 | 17.8 | 0.9 | 63 |
| Armac Demolition | 6.6 | 0.9 | 3.4 | 12.1 | 0.2 | 61 |
| MGL Demolition | 8.7 | 2.1 | 3.6 | 12.3 | 0.4 | 49 |
| Central Demolition | 9.6 | 2.1 | 5.5 | 11.6 | 0.4 | 47 |
| Safedem | 6.6 | 1.1 | 2.4 | 13 | 1 | 47 |
| Reigart Contracts | 10.7 | 0.4 | 4.5 | 9.6 | 0.4 | 46 |
| Keltbray Group | 65.5 | 12.3 | 11.9 | 144.8 | 1.9 | 41 |
| Research Sites Restoration | 17.9 | 0 | 0.3 | 82.1 | 0.4 | 41 |
| 777 Demolition | 12.5 | 5.9 | 4.9 | 11.8 | 0.4 | 40 |
| Storefield Group | 7.4 | 2.8 | 2.4 | 9.9 | 0.6 | 37 |
| McCallan Bros | 4.1 | 1.3 | 0.9 | 8.7 | 0.3 | 33 |
| TE Scudder | 7.3 | 0.1 | 2.8 | 17.1 | -0.7 | 33 |
| Brown & Mason | 39.4 | 6.4 | 11.5 | 30.1 | 0.9 | 27 |
| Syd Bishop & Sons | 16.6 | 4.2 | 4.1 | 14.1 | 0.1 | 25 |
| Wooldridge Ecotec | 5.4 | 0.9 | 1.2 | 11.4 | -0.1 | 22 |
| George Hunter | 9.2 | 3 | 1.7 | 7 | 0.2 | 18 |
| John F Hunt | 7 | 2.3 | 1.1 | 20.7 | -1.1 | 8 |
| Totals | 352.7 | 53.8 | 133.1 | 580.7 | 133.3 | |
| Averages | 14.1 | 2.2 | 5.3 | 23.3 | 0.5 | 49 |
| Average gearing ratio | 40% | |||||
| Average profit margin | 2.3% | |||||
| Return on capital | 10% |
Sector Comparisons
| Profit Margin | Return on capital | % Gearing | % with no borrowings | Average health score | % in warning area | |
| Road builders | 3.2% | 26% | 31% | 34% | 56 | 8% |
| Commercial Contractors | 1.8% | 13% | 17% | 50% | 52 | 5% |
| M&E Contractors | 1% | 7% | 7% | 60% | 52 | 9% |
| Plant Hirers | 14.9% | 26% | 79% | 4% | 59 | 8% |
| House Builders | 12.8% | 16% | 14% | 20% | 50 | 26% |
| Utilities & Water contractors | 3.9% | 23% | 6% | 46% | 57 | 8% |
| Scaffolding contractors | -0.8% | -8% | 114% | 37% | 53 | 32% |
| Demolition contractors | 2.3% | 10% | 40% | 12% | 49 | 16% |
This confirms the fragmented nature of the sub-sector. The Company Watch research shows a level of profitability for the sector of 2.3%, sharply down from 3.6% a year ago. Comparing it with the other seven sub-sectors we analyse for The Construction Index, demolition scores better than scaffolders (negative 0.8%), M&E contractors (1%) and commercial contractors (1.8%) but behind road builders (3.2%), those specialising in the utilities and water sectors (3.9%) and profitability stars in house building (12.8%) and plant hire (14.9%).
The average return on capital has also fallen sharply, down from 15% in our 2014 analysis to only 10% now. This is the third lowest amongst the sub-sectors. The trade-off between risk and reward varies across the construction industry, particularly when profits and borrowing levels are compared. For our 25 demolition contractors, gearing is at 40%, compared to 39% last year. This makes them more conservatively financed than scaffolders and plant hirers but more highly geared than the other sectors. Just three of the companies (12%) have no external borrowings at all.
Looking next at the overall financial health of our sample, we find an average H-Score (see box) of 49, just as it was a year ago. This is comfortably above the norm of 45 for all UK companies of similar size. The relatively low levels of debt play a part in this outcome, as does the fact that there are no companies with negative net worth (liabilities greater than assets). But it must be noted that this average H-Score is the lowest of all the construction sub-sectors. Four of the companies in the sample (16%) are in the Company Watch warning area, making it the third best on this test. Across the economy as a whole, the expectation would be that around 25% of any sample would be in this financial twilight zone. Looking at the better performers, 44% of the sample have H-Scores of 51 and above, as compared to around 50% for all UK companies. An unusually high tranche (52%) are in the third quartile with a score between 26 and 50. Three of the companies are loss making.
The deterioration in most financial indicators for demolition contractors over the past twelve months is a cause for concern and the speed with which troubles can overwhelm a business are demonstrated by the sad demise of Masterton. Its last published accounts (covering the year to December 2012) showed no sign of the fate that awaited it, giving it an H-Score of 67 as disclosed in the table accompanying this article. That said, the failure to file its 2013 accounts on time last autumn gave a hint as to the difficulty it was in. We will never know now what these figures might have revealed.
It is also worth repeating the comments from our previous reports that our figures cover only the few major players out of a market which also features thousands of smaller, generally undercapitalised and almost exclusively family-owned SMEs, including companies right down to unincorporated sole traders.
Many spend their time dealing with the negative financial implications of operating within potentially abusive relationships as subcontractors to more powerful and far bigger main contractors. Much more caution is needed about their finances. It seems that 2015 is likely to be a seriously challenging year for the construction industry as a whole, apart of course from the house building sector where different imperatives are driving performance. With the outcome of the impending General Election so uncertain, contractors are facing quite enough challenges without the prospect of political horse-trading in a hung Parliament or the frailties of a minority government making their profitability prospects even less secure.
This article first appeared in the April 2015 issue of The Construction Index magazine. To read the full magazine online, click here.
To receive you own hard copy each month in traditional paper format, you can subscribe at
http://www.theconstructionindex.co.uk/magazine#
Got a story? Email news@theconstructionindex.co.uk